DNS Logs
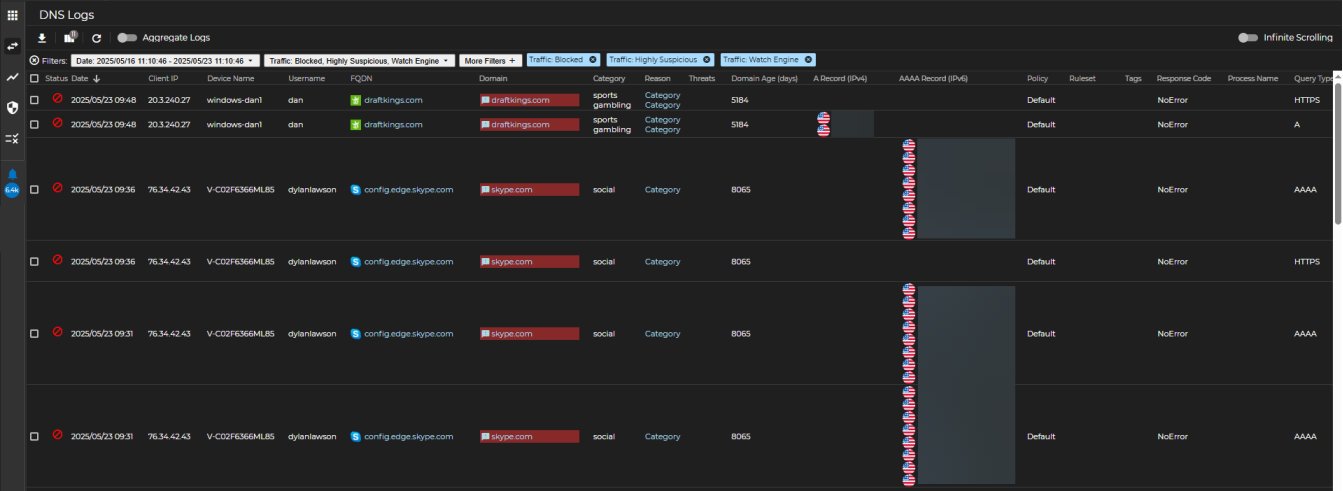
The Logs page displays all of your organization's DNS traffic log data. When first navigating to this page, you will be shown traffic that has been identified outside of normal, benign traffic. From there you can view all logs with the option of using advanced filtering to narrow or widen the search criteria.
Log View
This is the default view when navigating to the logs page. By default, the page will display the 4 types of traffic that has been rated as Blocked, Highly Suspicious, or on the Watch Engine. The remaining 2 traffic types that are not displayed by default are Normal and Permitted.
Additional Functions
The following additional functions and features are available on the Logs page.
Export Results
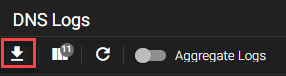
Selecting the Export Results option ![]() downloads the logs being displayed, or those that have been selected, into either JSON or CSV format. The current behavior is such that:
downloads the logs being displayed, or those that have been selected, into either JSON or CSV format. The current behavior is such that:
-
CSV will download the records selected in the sequence (columns and order) shown in the UI.
-
JSON will download an entire dump of the records selected and ignores the column selected via the UI.
Customize View
This icon will enable customization of the column order and present columns, as well as resetting to the default. The ability to filter on 5 types of traffic and 24 More Filters options. The 24 options that may be filtered on are listed below.
| A Record IP ADDRESS - Keyword | AAAA IP ADDRESS - Keyword | Answer Country NAME - Keyword | Client IP IP ADDRESS - Keyword |
| CName NAME - Keyword | CName FQDN FQDN - Keyword | CName TLD TLD - Keyword | Device Name NAME - Keyword |
| FQDN FQDN - Keyword | Domain DOMAIN - Keyword | Domain TLD TLD - Keyword | Domain Age NUMBER - Numeral Range |
| Domain Category NAME - Multiselect | FQDN Nameserver FQDN - Keyword | Nameserver DOMAIN - Keyword | NS TLD TLD - Keyword |
| NS IP IP ADDRESS - Keyword | Nameserver Country NAME - Keyword | Policy NAME - Keyword | Process Name NAME - Keyword |
| Query Type NAME - Multiselect | Registrar NAME - Keyword | Response Code NAME - Multiselect | TTL NUMBER - Numeral Range |
Refresh
Use this button to refresh the log entries with real time traffic.
Aggregate Logs
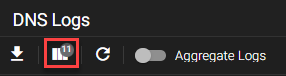
The Aggregate Logs function narrows your focused based on specific aggregates, such as Country, Device Name, Domain, FQDN, or Status. The default time-frame is to aggregate on a single day, with a maximum window of 7 days, and limited to the last 90 days. Aggregations on top of aggregations are supported by clicking on the ![]() icon where applicable. When clicking on the link available in the Count column, it will show the log view as aggregated by your criteria in a fly-out panel. Simple filters can be applied to each aggregation. A few aggregations have a special empty value that cannot be taken further in either aggregation or to the log view via the count.
icon where applicable. When clicking on the link available in the Count column, it will show the log view as aggregated by your criteria in a fly-out panel. Simple filters can be applied to each aggregation. A few aggregations have a special empty value that cannot be taken further in either aggregation or to the log view via the count.
-
Country: No Country
-
Device Name: No Device Name
-
Status: Normal
Infinite Scrolling
Activate Infinite Scrolling to avoid paging through logs. Data will be automatically loaded as you scroll through the logs.
Artifact Interaction
It is possible to right-click on nearly all artifacts in your network traffic, as displayed on the Logs view. An artifact can be “Client IP”, “FQDN”, “Domain”, or any of the other columns that can be toggled. Some artifacts have a couple options, while others have a handful or more.
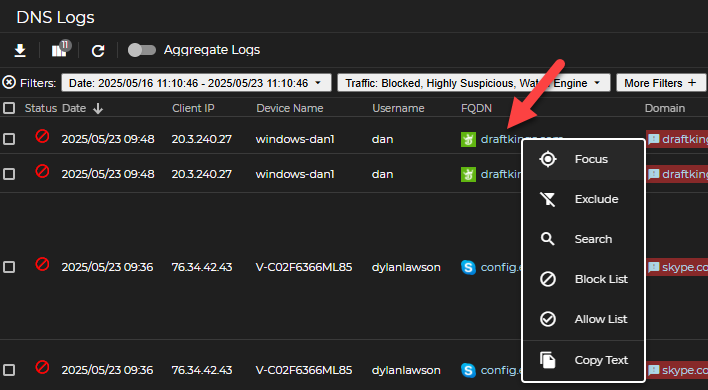
Artifacts that do not provide UltraDDR UI options when right-clicking include the first two (2) columns are Checkboxes and Status, as well as any blank fields.
Each artifact on the Logs view contains the following options:
Focus
-
When selected, the right-clicked artifact will apply a filter that displays all the logs that match the filter.
-
Applies to: All artifacts that can be right-clicked
Exclude
-
Inverse of focus, when selected, the right-clicked artifact will apply a filter that excludes logs that match the filter.
-
Applies to: All artifacts that can be right-clicked, except Date.
Search
-
This option will open a Google search page pertaining to the artifact you right-clicked.
-
Applies to: FQDN, Domain
Blocklist
-
Add to the Default Blocklist for the specific artifact type (FQDNs, Domains, IP Addresses, CIDRs, Nameservers, and Registrars)
-
To view/edit this action, browse to the “List Management” global icon, “Blocklist” should be toggled on by default, and then browse to the tab of the artifact type that has been blocked.
-
Applies to: Client IP, FQDN, Domain, FQDN Nameserver, ARecord IP, and Registrar
Allowlist
-
Add to the Default Allowlist for the specific artifact type (FQDNs, Domains, IP Addresses, CIDRs, Nameservers, and Registrars)
-
Applies to: Client IP, FQDN, Domain, FQDN Nameserver, ARecord IP, and Registrar
Copy Text
-
Copies the selected artifact to your local clipboard.
-
Applies to: All artifacts that can be right-clicked
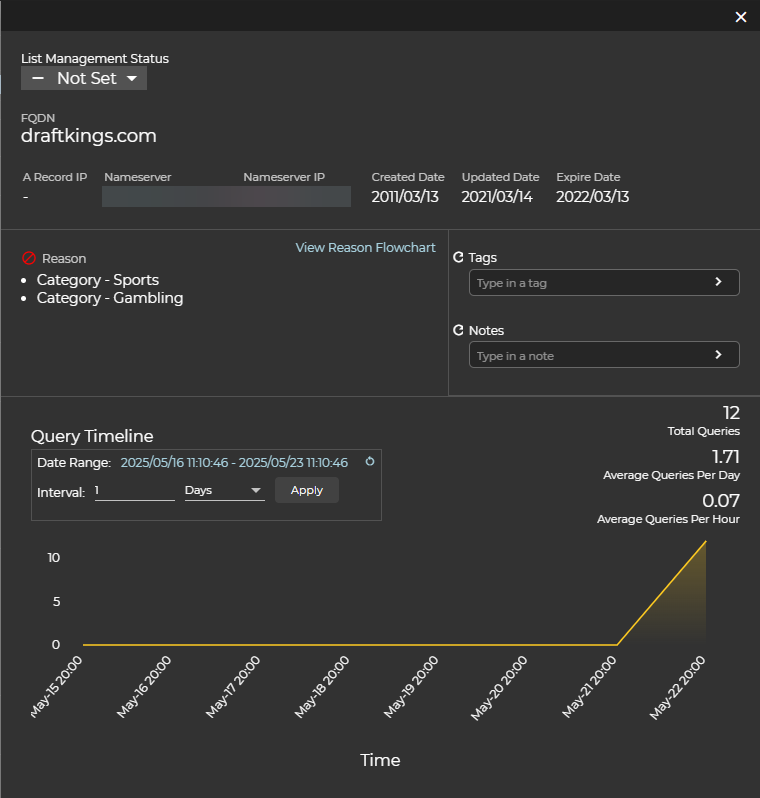
Information panel
To get additional information on an artifact, simply click on it and a panel will open on the right that contains useful information and options.
Blocklist Status
To see if the artifact is on the block or allow list and will allow you to set or change the list.
Reputation
This will tell you why UltraDDR has flagged an artifact the way it has.
Tags
Here you can see if an artifact has been tagged by another user or automatically via our DGA feed. For example, you may see tags related to malware or campaigns.
Notes
Here you can see or add notes related to an artifact.
Query Timeline
This section has a visual representation of the query pattern for an artifact. You can select the time/date range as well as toggle between hourly and daily views. You will also see the Total Queries, Average Queries Per Day and Average Queries Per Hour.