Dashboard Overview
The primary Dashboard Overview for UltraDDR shows an aggregated view of DNS traffic activity. This perspective provides a birds-eye view of the DNS traffic. Additionally, you can toggle to view the Executive Dashboard for a more detailed view.
| The Dashboard view selected when logging out, is the same Dashboard view displayed when logging back in. |
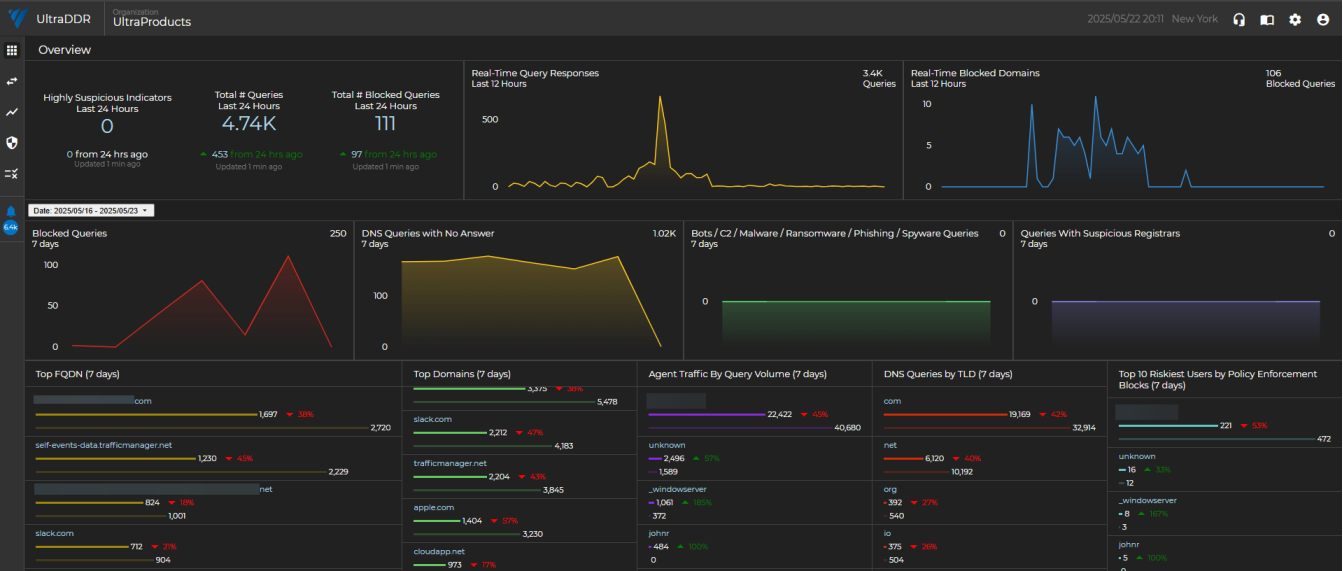
The Date toggle option will apply to all tiles on the page except the first row, which is fixed at 24 and 12 hours. This toggle has many date/time range options to narrow or widen the following sections and tiles.
Tiles
| Section | Description |
| Highly Suspicious Indicators | A real-time look at the number of malicious indicators UltraDDR has flagged within your organization’s network traffic as “Highly Suspicious”. |
| Real-Time Query Responses | A real-time look at the volume of network traffic for the organization in the last 24 hours. |
| Real-Time Blocked Domains | A real-time look at the number of queries that are actively being blocked in the last 24 hours. |
| Blocked Queries | These are queries to known malicious domains. They may be related to phishing, scamming, botnets, malware downloads, or malware command and control structures. These queries were all successfully blocked by UltraDDR, but may not have been reported as an alert or security event. |
| DNS Queries with No Answer | It is not uncommon for DNS queries to have no answers. Most common is a user mistyping a domain, or a sysadmin mis-configuring an automated system. NXDOMAIN queries can also be symptomatic of a security event. Spikes in NXD queries should be responded to quickly and investigated thoroughly. |
|
Bots/C2/Malware/Ransomware |
Domains were tagged because it points to an IP that we have verified to be related to onion routing (aka dark web). |
| Queries With Suspicious Registrars | Domains were tagged because the registrar handling this domain also has a number of other known malicious/risky domains on it, or has other characteristics that implicate this registrar (and the domains on it) as risky. |
| Top FQDN | These are the most frequently visited "Fully Qualified Domain Names" for the last “X” days (7 default). Review this information frequently for spikes and changes in traffic as this could be an early indicator of new, high-risk behavior from within the organization. |
| Top Domains | These are the most frequently visited root domains for the last “X” days (7) by default). Review this information frequently for spikes and changes in traffic as this could be an early indicator of new high risk behavior from within the organization. |
| Agent Traffic by Query Volume | These are the agents with the highest traffic by query volume for the last 7 days. |
| DNS Queries by TLD | UltraDDR applies different reputation weights towards various top level domains. Monitor this data frequently for spikes in suspicious TLDs (.ru, .xyz, and so forth). |
| Top 10 Riskiest Users by Policy Enforcement Blocks | The users with the most monitored violations or actions blocked by policy enforcement. |
Clicking on any of the links from the Overview page will direct you to the Logs Page page.
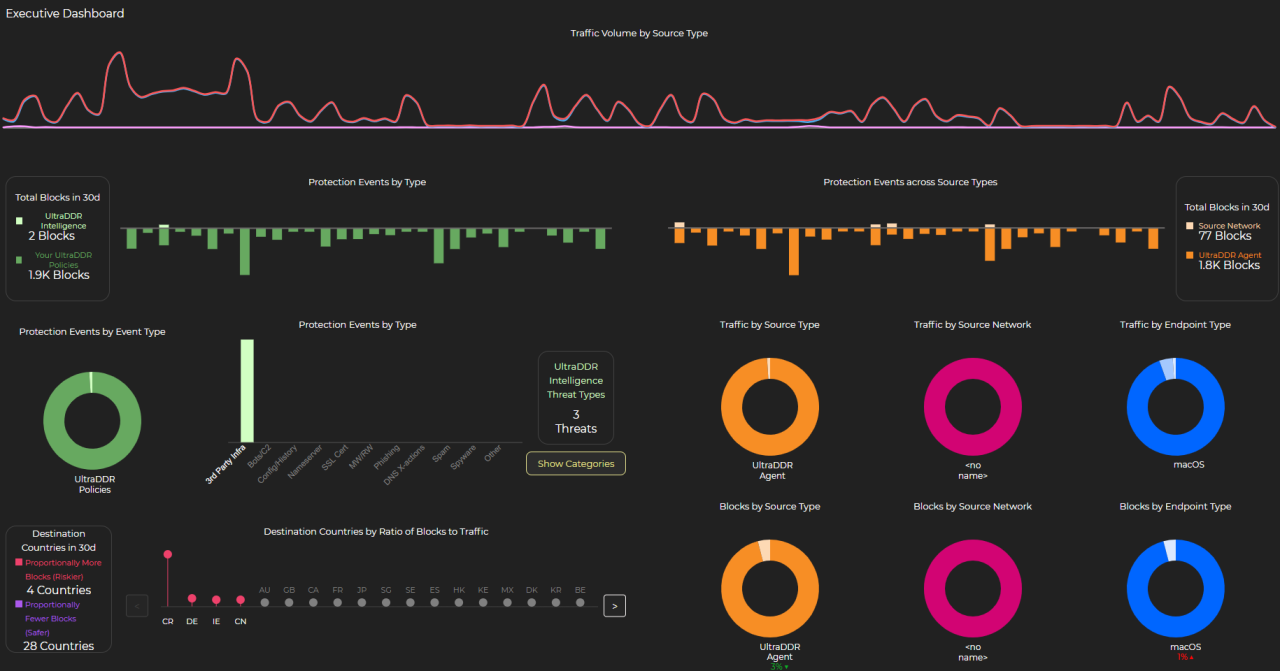
Executive Dashboard
The Executive Dashboard is a toggle-able view that provides a high-level overview of your organization’s security posture and activity. The Executive Dashboard offers are more clear and concise view of your network activity and protected outcomes with benefits including:
-
Enhanced Visibility: Provides a high-level overview of security metrics, allowing executives and analysts alike to easily assess the organization’s security posture and the value UltraDDR delivers.
-
Improved Decision-Making: With detailed insights into traffic sources, protection events, and block ratios by country, executives can make more informed, strategic decisions to strengthen security defenses.
-
Streamlined Reporting: Simplifies reporting processes by consolidating critical data in one place, enabling faster and more efficient communication across different levels of the organization.
-
Proactive Threat Management: Enables better identification of potential risks by offering real-time insights into traffic volume and threat sources, helping to proactively address vulnerabilities.
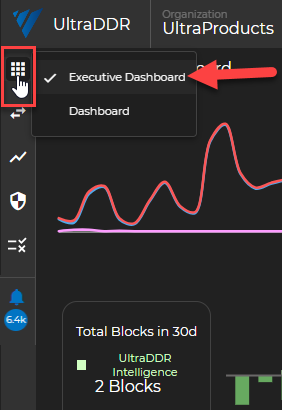
To view the Executive Dashboard, from the left-hand navigation menu, hover over the ![]() icon, and select Executive Dashboard.
icon, and select Executive Dashboard.
Charts and graphs are designed to be hovered over to get more granular results when viewing your traffic details. Additionally, key areas to focus on are:
-
Traffic Volume by Source Type: Helps you to understand where your traffic is coming from and identify potential risks.
-
Protection Events by Type and Source: Allows you to quickly gain visibility into the types of threats being blocked and their origins.
-
Block Ratios by Country: Lets you easily see how your security measures are performing globally, broken down by geographic location.
Clicking on any of the charts or diagrams will redirect you to the logs page and display results for the specific chart/report type you selected.